Overview
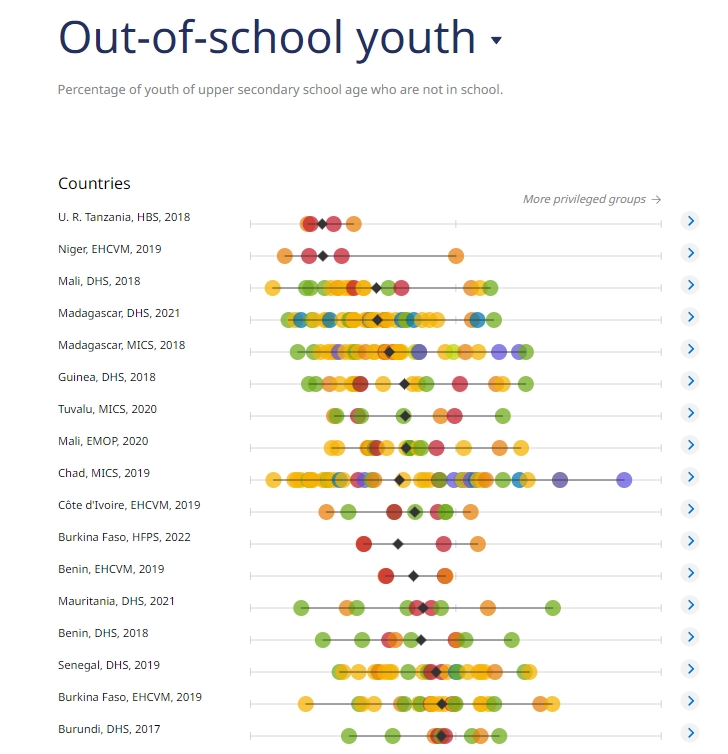
This page provides comprehensive insights into the completion rates for upper secondary education from 2017 to 2022. The data is presented through various graphs and tables, which facilitate clear and convenient comparisons across different years and age groups.
Yearly Trends
The data highlights changes in completion rates on an annual basis. By examining these trends, you can identify key patterns, such as increases or decreases in completion rates over time. This information is valuable for analyzing the impact of educational policies and other factors that may influence educational outcomes.
Relevant Age Groups
Completion rates are analyzed according to specific age groups, offering a detailed view of educational attainment within these demographics. This breakdown helps to understand variations in educational success among different age groups and can pinpoint specific challenges or achievements.
Data Source
The data presented on this page is sourced from the Education Inequalities Initiative. This organization specializes in collecting and analyzing educational data, allowing for accurate comparisons between countries and across different time periods.
Purpose
The goal of this website is to present educational data in a way that supports comparison and analysis of the effects of various educational policies. This information is crucial for understanding trends in educational achievement and for developing effective policies to improve educational quality.


