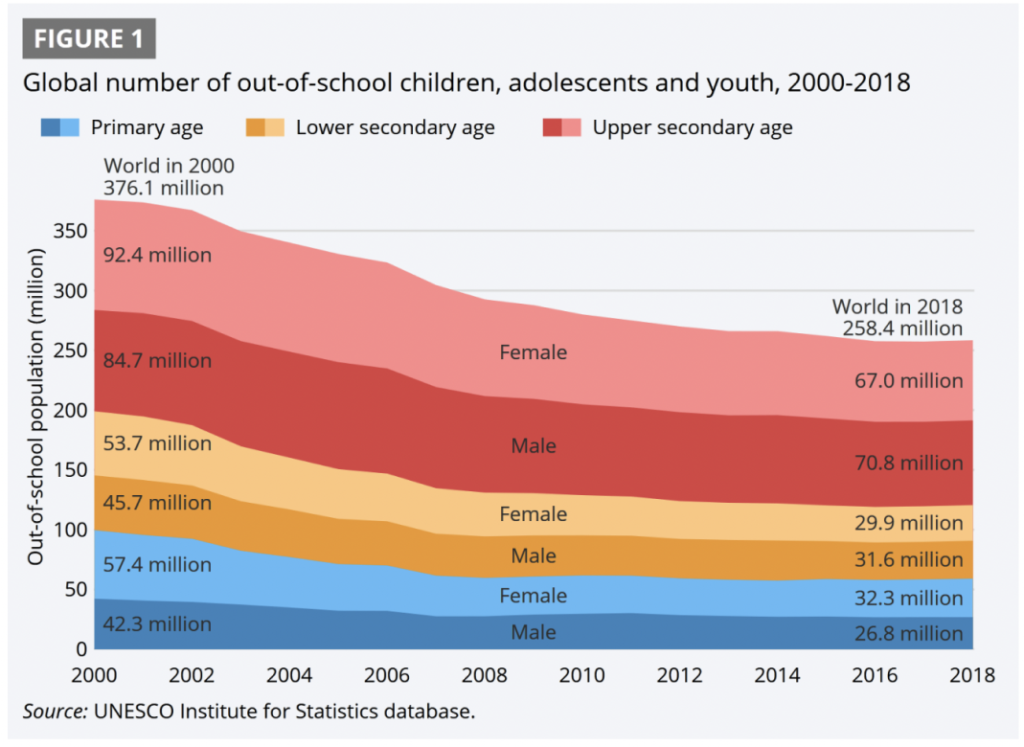
The graph below (figure 1) presents the matter globally, by primary, lower secondary and upper secondary levels.
Global number of out of school children

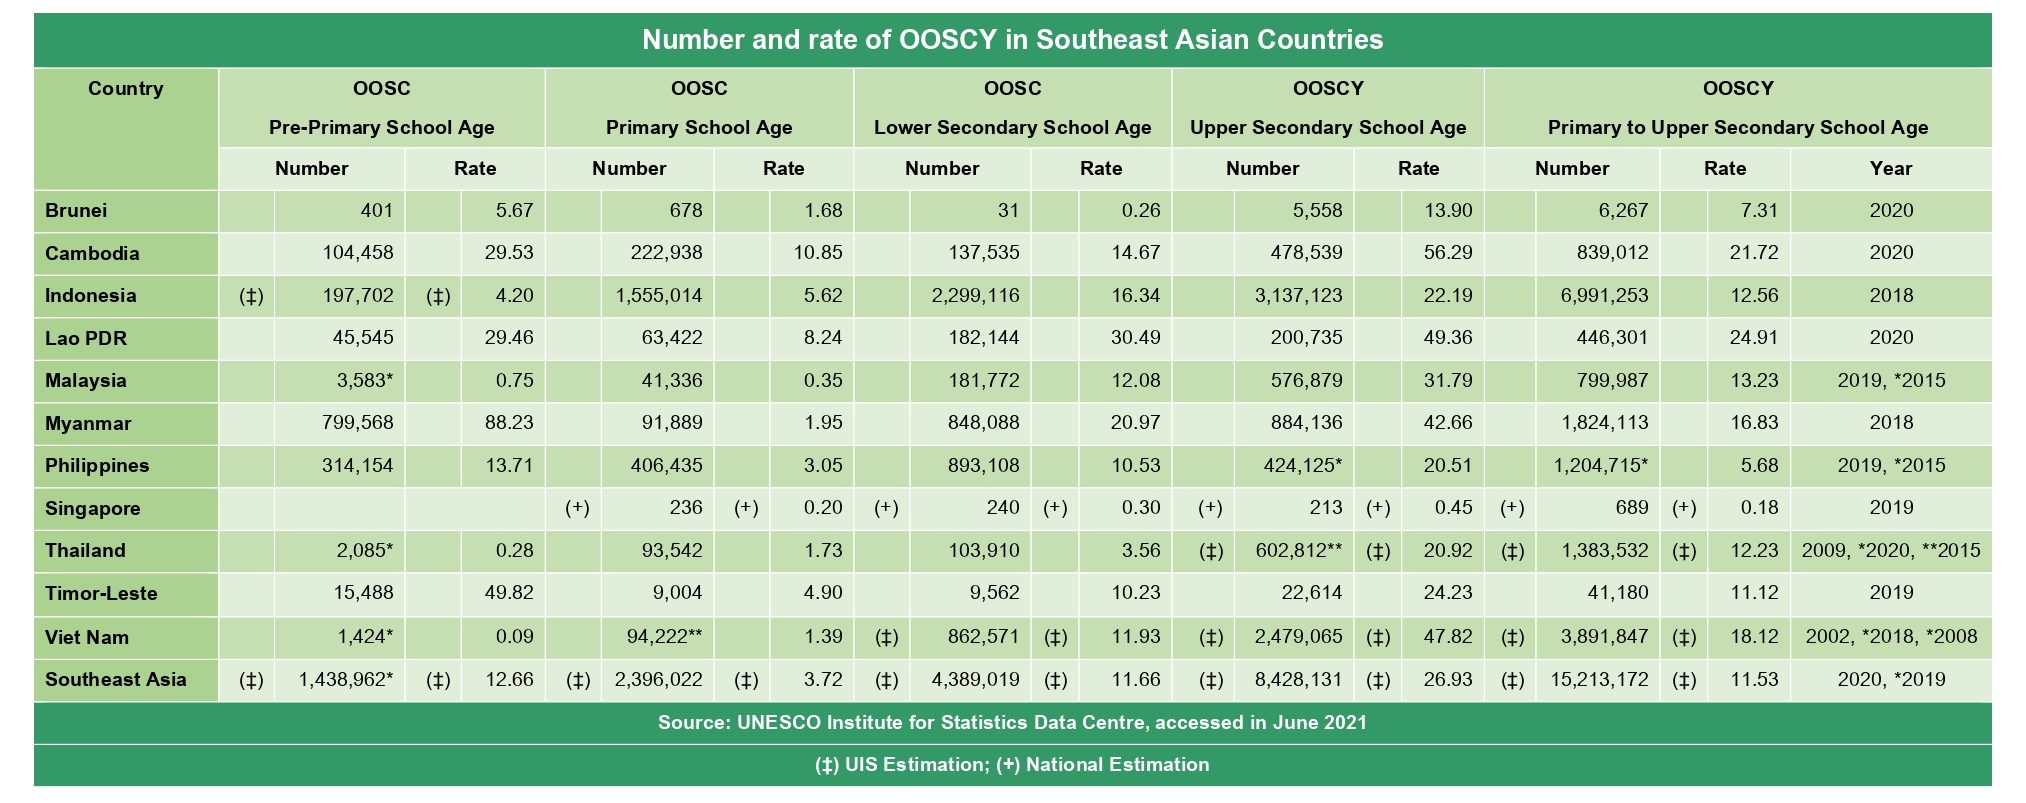
This table shows the situation in the Southeast Asia region. The table data is administrative data, and it reveals how some of the countries have been unable to collect data and track progress. The general picture of the situation, together with disparities where data is available (gender, location, wealth) is presented in the Educational Disparities table, which is built of household survey data. More in-depth analysis can be found from the chapters Gender [link to Gender Disparities & Intersectionality page] and Socio-Economic Disparities & Location
Few of the key findings could be summarized to that there are still lots of room for improvement in with levels of education acquired, gender work in rural areas and especially with socio-economic disparities. One key observation can be also identified in between data sets administrative and household survey data.
You can explore more differences between data sets here.
OOSC Rate and Educational Disparities in South East Asian
Countries According the school level (household survey data)

It’s not only important to offer universal access to education to everyone, but also make sure the education is being completed. In Eastern and South-Eastern Asia the completion rates (on average) are 96% in primary school but only lower secondary 81%. Covid has caused a drop in both participation and completion rates will also have an effect on achieving the minimum proficiencies.
You can access your country’s situation by using the education inequalities tool. You can explore all the key statistics, but more interestingly also get to see the variance by disparities like gender, location, region, wealth, religion, and language! On this page, we’ll be updating news, report, and articles on the development – we sincerely hope the situation will get better!


